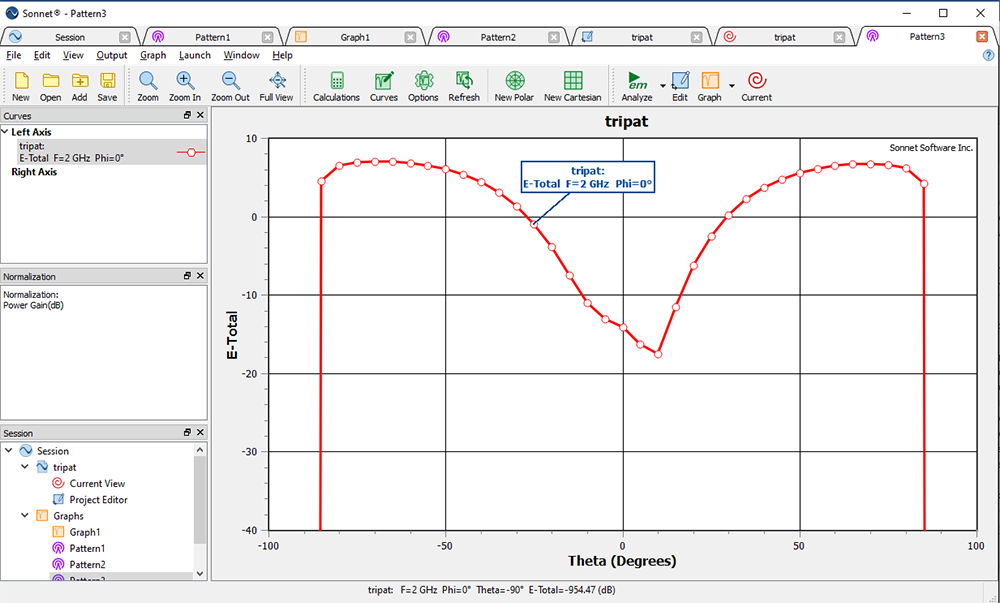
The Curves panel in the Far Field Pattern Tab Window lists all of curves presently plotted on your graph. For a Cartesian plot, there are two sections: Left Axis, and Right Axis. Curves plotted on the axis are displayed in that axis list. Curves are added to your plot by selecting Graph - Manage Curves from the Far Field Pattern Tab main menu.
Each curve entry identifies the measurement, the project file from which the data is drawn and how the curve is represented in the plot, as shown in the example below.
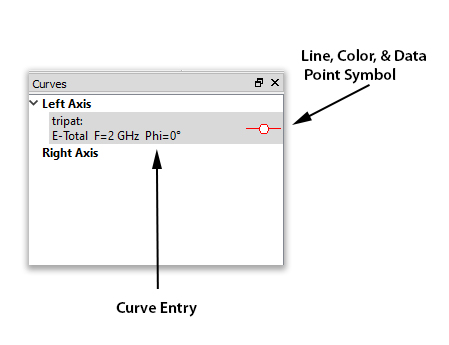
The curve entry above identifies the project name ("tripat"), the polarization (E-Total), the frequency (2 GHz), and the value of phi (0 degrees). This curve is plotted on the left axis and is represented by a red line. Discrete data points on the curve are shown with a circle.
You may open the Manage Curves dialog box by right clicking anywhere in the Curves Panel and selecting "Manage Curves" from the pop-up menu which appears. Double-clicking on any entry in the Curves Panel also opens the Manage Curves dialog box. To delete a curve, right click on the curve entry and select "Delete" from the pop-up menu, or select the curve and press the Delete key.