To Tune a curve, right-click on the desired curve in the Curves panel, then select "Tune Curve" from the pop-up menu which appears. The Tuning panel is opened in the Graph tab. This panel allows you to interactively change the value of variables in your project and see the effect on your response.
The controls are detailed below.
The main part of the window consists of a slider bar control for each variable selected for Tuning. If no slider bars appear in the panel, click on the Enable/Disable button to open the Enable/Disable Parameters dialog box, to select which variable(s) you wish to tune.
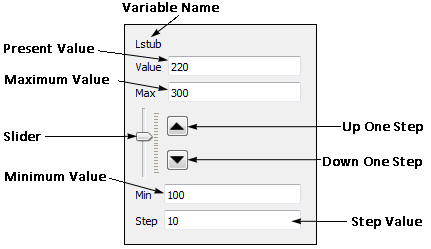
The slider bar for the variable Lstub is pictured below. You may change the value of the variable by dragging the slider or by clicking on the Up One Step or Down One Step button. The step buttons will increase or decrease the value of the variable by the amount entered in the Step text entry box. Default values based on the present value of the variable are entered in the slider bar but may be edited. As you change the value of a variable using its slider bar, the plot is updated according to the setting in the Update drop list (see below).
Note that the variable may only be set to values for which data was calculated in your simulation. If no data is available for that value, a warning "Unable to tune to this position" appears.

Update Drop List: This drop list controls when your plot is updated for changes made in the variables. There are three choices:
Tune: Click on this button to update your plot. This button is only enabled when "After Pressing Tune" is selected in the Update drop list.
Update Project: When the variables being tuned are at the desired values, you click on this button to update your project and set the nominal value of the variables to the value displayed in present value in the slider bar.