Selecting Plot - Scale opens the Scale dialog box which allows you to change the scale of the plot displayed in the Scale panel. The present settings are shown on the left side of the panel next to the color scale.
Click on Auto Scale to get a good starting value for the scale. The initial scale when the current density viewer is started is set to an autoscale factor of 1.
The autoscale factor entered changes the minimum and maximum values for the scale. When this option is used, first the current density viewer calculates the standard deviation and average current density over the entire metal region on the present level. It then sets the maximum scale according to the following formula:
maximum = average + ( autoscale factor) * (standard deviation)
For example, entering in an autoscale factor of "3" sets the maximum value to the average plus 3 standard deviations. The minimum scale value is set to zero.
If you wish to set the scale minimum and maximum values, click on the Manual Scale radio button. This will enable the Max Value and Min Value text entry boxes. Enter the desired values by editing the text entry boxes.
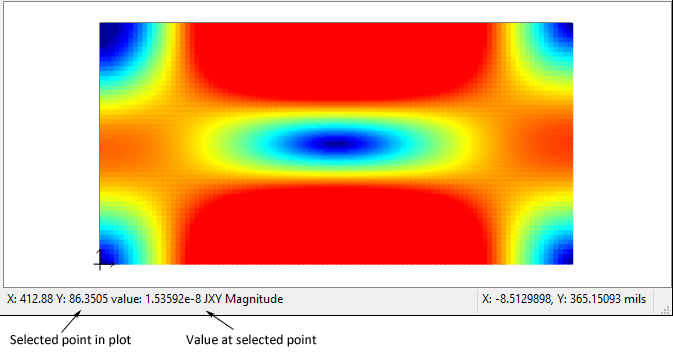
TIP: To determine values for setting a manual scale, it can be helpful to click on your current distribution plot and observe the values displayed in the status bar at the bottom of the Current Density tab, as pictured below.
