Provided below are some examples illustrating how custom equations may be defined for use in the Sonnet Project Editor and/or Sonnet Graph.
The following equation illustrates how the skin depth of a metal conductor may be computed in the Sonnet Project Editor. Here, Sigma is the metal conductivity in Siemens per meter. FREQ is a variable which represents the frequency in Hertz. TWO_PI and MU_0 are pre-defined constants, provided by Sonnet, representing 2.0* π, and the permeability of free space, respectively. The computed skin depth is in meters. In the Sonnet Project Editor, the procedure is to define the Name and Value of one or more variables. In the example, we have a variable named "Sigma" with a value of 4.09e7, and a second variable named "SkinDepth" with the value returned by the square root function.
Sigma = 4.09e7
SkinDepth = sqrt ( 2.0 / (TWO_PI * FREQ * MU_0 * Sigma) )
The following equation illustrates how the Q-Factor of a 3-port center-tapped inductor may be computed in a Sonnet graph. Ports 1 and 2 are in the input and output inductor ports, respectively, and port 3 is the center-tapped port. In the first line below, an argument named "Y11" is computed from a 2-port Z-parameters of the inductor (port3 is open-circuited). Then, in the second line, the Q-Factors is computed using the argument "Y11."
ARG Y11 = Z22 / (Z11 * Z22 - Z12 *Z21)
mag(imag(Y11) / real(Y11))
The following equation illustrates how the difference between simulated and measurement results for the S21 may be computed and viewed in a Sonnet graph. Here, two separate arguments are defined for the measurement and simulated data sources. Notice that the S21 is proceeded by an index (1 for the measurement data source, and 2 for the simulated data source) followed by a semicolon.
ARG Meas = 1:S21
ARG Sim = 2:S21
FORMAT(Sim)-FORMAT(Meas)
By using this convention to define the arguments, two separate entries for the Data Source will appear in the Manage Curves dialog box of a Sonnet Graph. The first entry will allow you to choose the measurement data source (perhaps a data file in Touchstone format) and the second entry will allow you to choose the simulated data source(typically a Sonnet project). Shown below is an example of the Properties section in the Manage Curves dialog box with these two data sources.
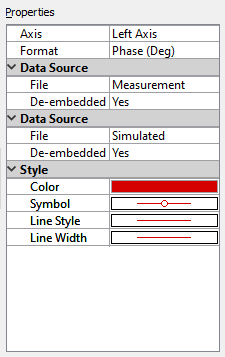
The above difference equation also makes use of the FORMAT() function. The FORMAT() function is useful when you want to be able to change how complex data is displayed from the Manage Curves dialog box. Notice that in the above Properties window, there is a Format droplist, and it is set to "Phase (Deg)." By using the FORMAT() function in the equation, this Format droplist will appear in the Properties window, and you then have the ability to choose how to display the complex data: Magnitude (dB), Magnitude, Phase (Deg), Phase (Rad), Real, or Imaginary.