Manage Curves Dialog Box (Graphs)
To open the Manage Curves dialog box, select Graph > Manage Curves from the Graph tab main menu, or click the Curves button in the Edit toolbar: ![]() . This dialog box allows you to manage the curves in your graph. You may add, modify, delete, group and ungroup curves, control how they are displayed, and select the axis on which they are displayed.
. This dialog box allows you to manage the curves in your graph. You may add, modify, delete, group and ungroup curves, control how they are displayed, and select the axis on which they are displayed.
There are three sections in the Manage Curves dialog box: Curves, Measurement, and Properties. The dialog box is designed so that you start on the left and move to the right. Select or add a curve in the Curves section, then select the desired measurement for that curve in the Measurement section. Finally, input the measurement's properties in the Properties section.
After selecting a curve or curves in the Curves section, selections made in the Measurement and Properties sections affect the presently selected curve(s). The picture below shows a sample of the dialog box for a Cartesian graph when S-parameters are selected. Changing the Measurement or using a Smith Chart will change the appearance of this dialog box.
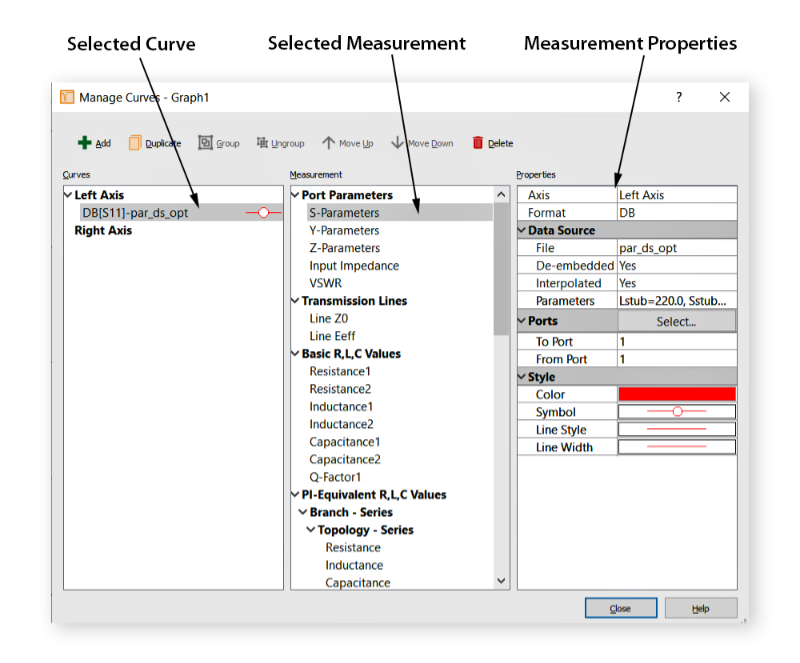
The three sections are detailed below:
Curves Section: This section lists the presently defined curves. You may add, delete, group, and change the order of curves by using the buttons at the top of the dialog box. Use the Shift and Ctrl keys to select multiple curves.
Measurement Section: This section defines the measurement used for the curve that is selected in the Curves section. The measurements are divided into six categories:
- Port Parameters
- Transmission Lines
- Basic R,L,C Values
- Pi-Equivalent R,L,C Values
- Inductors and Transformers
- Specialized Equations
You may hover over the measurement for a brief description of the measurement, or you may click one of the links above to obtain detailed information about a measurement.
Properties: The appearance of the Properties section is updated depending on the selection in the Measurement section. See Measurement Properties for an explanation of each field.