Selecting Graph - Manage Curves from the main menu opens the Manage Curves dialog box. This dialog box allows you to manage the curves in your plot. You may add, modify, delete, group and ungroup plots, and control how they are displayed and on which axis. You define the data that is plotted in a curve by selecting a measurement type.
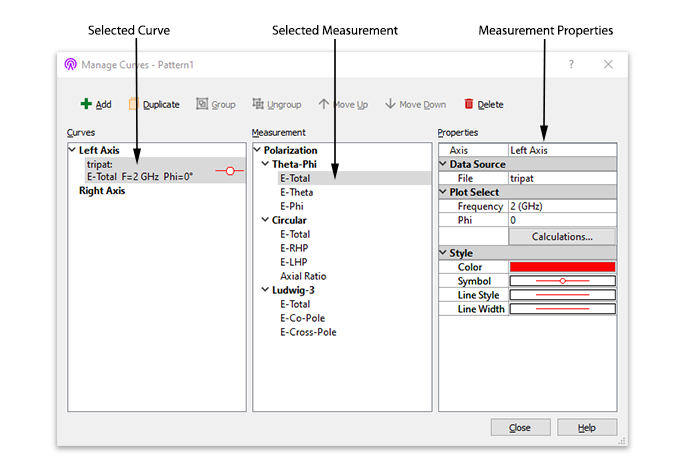
There are three sections in the Manage Curves dialog box: Curves, Measurement, and Properties. The dialog box is designed so that you start on the left and move to the right. You select or add a curve in the leftward panel, then select the desired measurement for that curve in the middle panel, then input the measurement's properties in the rightward panel.
Selections made in the Measurement and Properties sections affect the presently selected curve(s). The appearance of the Properties section is updated depending on the selection in the Measurement section. The help topic for each measurement type explains the controls in the Properties column.