Sonnet’s response viewer allows you to place a marker to label important data points in your plot. In this section, you will add a marker to identify the maximum Q factor and the frequency at which it occurs.
The curve is highlighted and a pop-up menu appears.
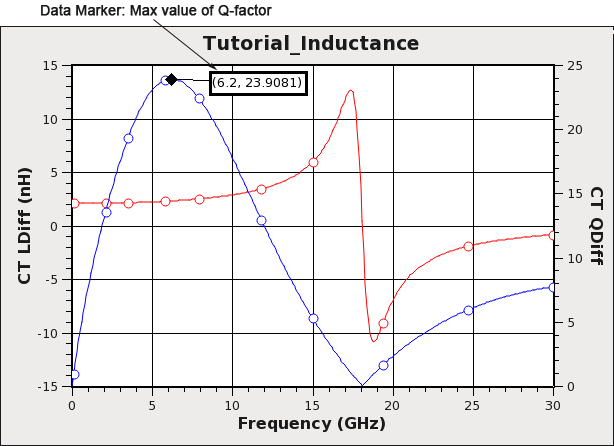
A marker is added to the graph, with a line extending from the selected data point to the label. The label displays the value of the data point and the frequency at which it occurs.
The marker is moved to the maximum value of the Q-factor in the curve whose value is 23.9081 which occurs at 6.2 GHz. After the marker is added you may change it's position by dragging it to the desired location.
The Sonnet session window is closed.