You may examine the results of your simulation in Sonnet’s response viewer. In this section of the tutorial, we will plot the differential inductance and differential Q by using equations. You will also learn how to add a marker to your plot. Note that there are also equations available to plot the single-ended inductance and Q factor of your circuit if you wished to see those values. The equations we will use allow you to look at the results differentially.
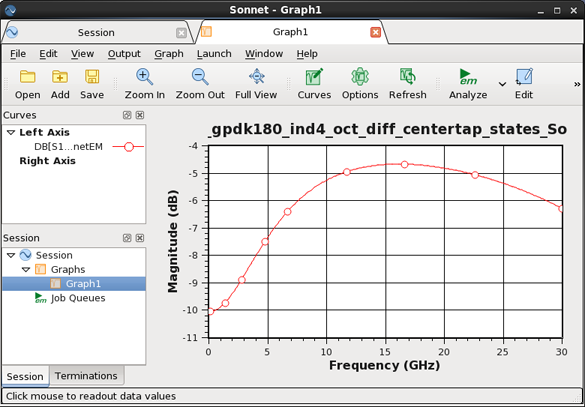
Sonnet’s session window appears on your display with a graph tab that contains a plot of DB[S11]. This is the factory default curve displayed the first time a graph is opened for a project. You may also select Results - View Response from the main menu of the Sonnet Cadence Virtuoso Interface window to invoke the response viewer.
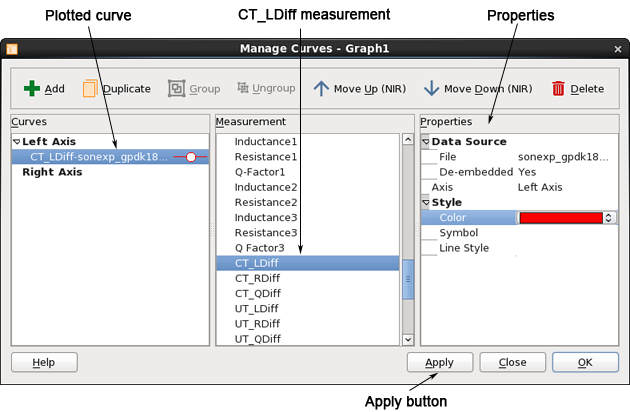
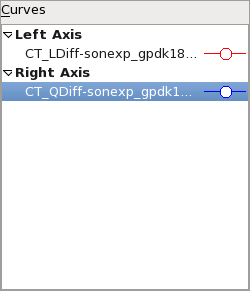
The Manage Curves dialog box appears on your display.
The curve entry is highlighted. Selecting the curve allows you to edit the curve. Note that the present settings of the curve are displayed in the Measurement panel and the Properties panel.
The Properties panel is updated with the inputs for the differential inductance of a center-tapped inductor. The default properties do not need to be changed for the tutorial.
The plot is updated with the differential inductance. The curve entry is updated in the Manage Curves dialog box to display CT_LDiff.
The default curve, DBS[11] is added to the curve list and is selected.
The Properties panel is updated with the inputs for the differential Q factor of the inductor.
The entry is updated and now displays a drop list.
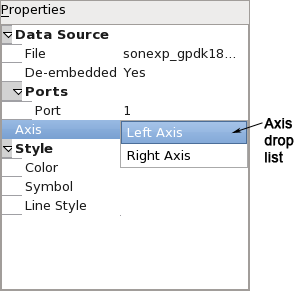
The Q Factor curve will be plotted on the right axis.
The dialog box is updated and the curve is now listed under the Right Axis. The plot is also updated.
The dialog box is closed.
The Graph Options dialog box is opened on your display.
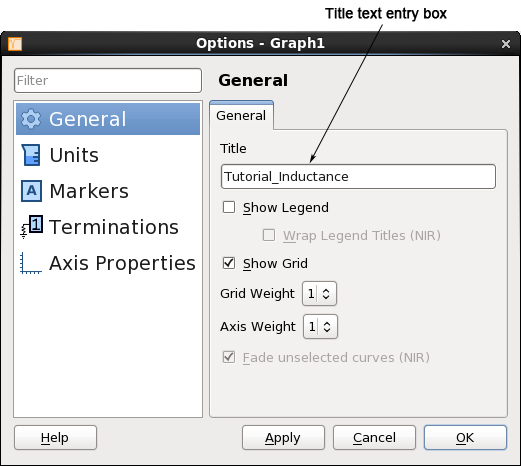
The appearance of the dialog box is updated to display the General page.
The automatically generated label in this case is quite long, so using the shorter label makes the plot easier to understand. The dialog box should now appear similar to that shown below.
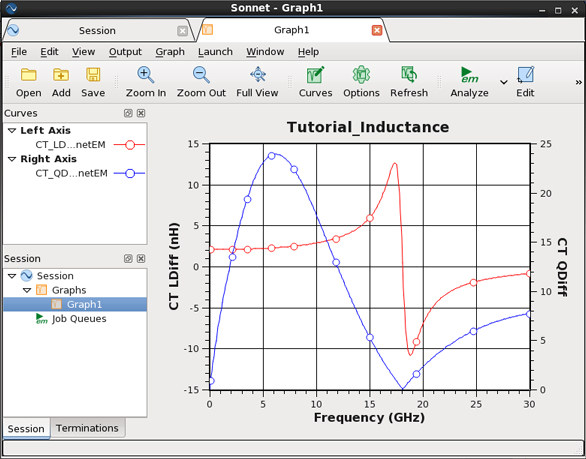
The plot now displays the new title and the two curves as shown below. The Differential Q Factor is on the left axis and the Q factor is on the right axis as shown below.