Once you have defined variables in your circuit, you may use the variables to perform a parameter sweep. A parameter sweep allows you to run through a set of analyses, with different variable values, all in one step. This allows you to see how changes in your circuit affect the response of your circuit.
You set up the parameter sweep in the Sweeps page of the Circuit Settings dialog box in the project editor. To access this dialog box, select Circuit ⇒ Settings from the main menu of the project editor. In the dialog box which appears, select Sweeps from the side bar menu. You should select the Perform parameter sweeps checkbox before adding any sweep sets.
All frequency sweep types are available for a parameter sweep. You may allow one or multiple variables to change when running a parameter sweep.
Sweep modes allow you to control what variable combinations are analyzed for a parameter sweep. Sweep modes for a parameter sweep include Linear Sweep, Exponential Sweep, Value List, Single Value, Corner Sweep, and Sensitivity Sweep.

where Nc is the number of combinations and Nv is the number of independent variables selected for the parameter sweep.
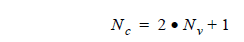
where Nc is the number of combinations and Nv is the number of independent variables selected for the parameter sweep.
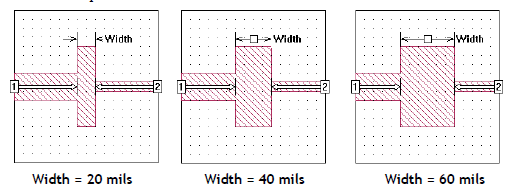
For example, the graphics below illustrate a linear parameter sweep of the circuit “steps” with a single dimension parameter whose value is defined as the variable “Width.” The parameter sweep starts with a value of 20 mils for the variable and increases in steps of 20 until the variable’s value is 60. Em automatically performs an analysis at each specified frequency for each circuit shown below when the parameter sweep is executed.
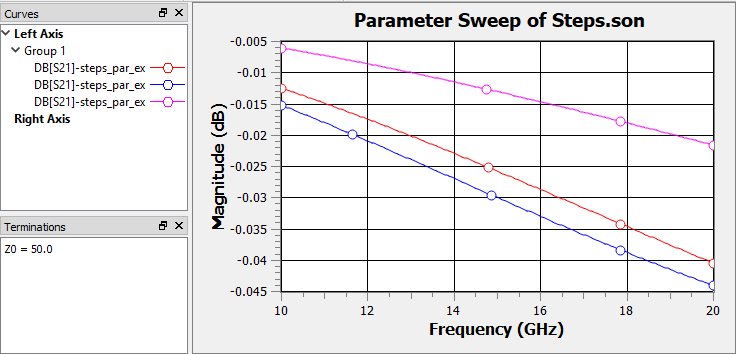
In the case of this sweep, an ABS analysis from 10 - 20 GHz was performed. The response data for the parameterization is shown in the graph below.
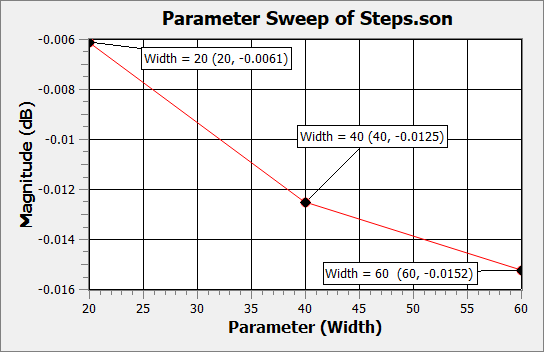
You may also plot your response data against the parameter values by selecting the Graph ⇒ Plot Over ⇒ Parameter command in the response viewer. Shown below is the plot of the magnitude in dB of S21 versus the variable Width at 10 Hz. Data markers have been added to the plot for clarity.
Since an analysis of the circuit at each combination of variable values is executed for each specified analysis frequency, care should be taken when choosing data ranges. The higher the number of analysis frequencies and variable values, the higher the number of analyses that must be computed by em.