Current Density Plots
The Current Density tab displays the Current Density Viewer, which is a visualization tool used to view results from an EM analysis as a color shaded plot. The colors can represent the magnitude or phase of current density or charge. Both 2D and 3D views are available. It is also possible to animate your results as a function of frequency or time.
The Current Density Viewer requires a Current Density Viewer license.
Prerequisite: Enable Compute Currents
Before you can view the current density of your project, you must enable the Compute Currents option in your project prior to analyzing your project. Once you have analyzed your project with this option enabled, the current density data is stored as part of your project and you may view the currents using the Current Density Viewer.
Opening a Current Density Tab
There are several ways to open a Current Density tab:
- Click the View Current button in the Session tab.
- Select File > View Current from the main menu in the Session tab.
- Right-click on a project in Session tab's list of projects and select View Current from the pop-up menu. This opens a current density plot of the selected project.
- Select Launch > View Current from the main menu of any tab other than the Session tab. This opens a current density plot of the active project.
- Windows Only: Right-click on a project file in File Explorer, then select View Current from the pop-up menu which appears.
Current Density Tab Window
The default Current Density tab is shown below. The default view is a 2D view of the top-most level of your circuit that contains current.
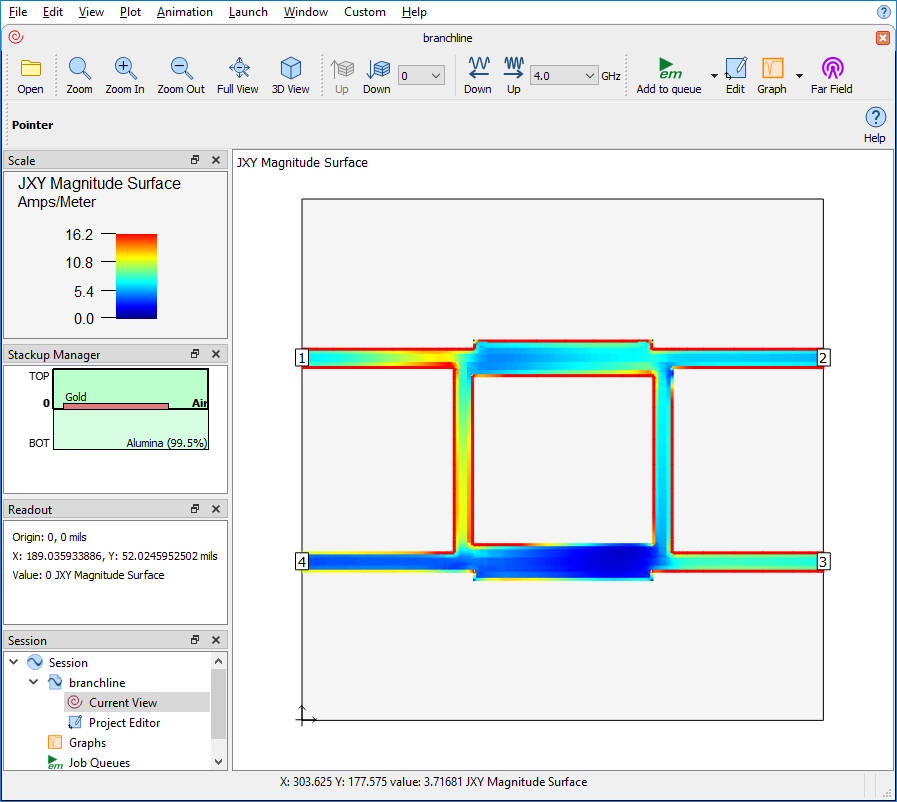
The default configuration is shown above. You may configure the layout of your window in any way that you wish. See Customizing Sonnet Windows for details.
Changing Your View
You may change the view of your circuit in several ways:
Levels: You may change levels by clicking the Up and Down buttons or by pressing the up or down arrows on your keyboard.
Frequencies: You may change frequencies by clicking the frequency arrows or by selecting the frequency from the drop-down list.
Viewing Current Density Values
You may move your mouse over any metal on your circuit and the Readout panel shows the current density value (in amps/meter) at those coordinates. You may also click on any metal and the same information is shown in the status bar at the bottom of the window. The Readout panel is updated whenever you move your mouse, but the status bar is only updated when you click on your circuit.
Scale
The Scale panel shows a mapping of the colors in your plot with current density values. By default, the maximum value is set to the average current multiplied by the standard deviation. You may manually change the scale by selecting Plot > Scale. This opens the Scale dialog box with the following options:
Auto Scale: You may enter an Auto Sale Factor. This factor is multiplied by the default Auto Scale value. The Minimum is always set to 0.0 using this option.
Manual Scale: You may enter a custom maximum and minimum value.
You may also change the color palette by selecting View > Options > [Colors]. See Colors (2D View).
Additional Considerations
The following details should be noted:
- The current densities plotted do not represent de-embedded data. Therefore, areas near any port include the effect of the port discontinuity.
- Only X and Y-directed currents are plotted in the 2D view. Z-directed current (from vias) is not displayed. However, a 3D view shows currents on vias.
- If you used an ABS sweep, currents are only shown for the discrete data points.