3D Patterns
This topic explains the settings for a 3D Far Field pattern. By default, a polar plot is opened when the Far Field Pattern tab is first opened. You may open a 3D pattern tab by clicking on the 3D View button  . You may also change your Initial Graph Type by selecting Edit > Preferences > [New Graph]. Shown below is the 3D View window.
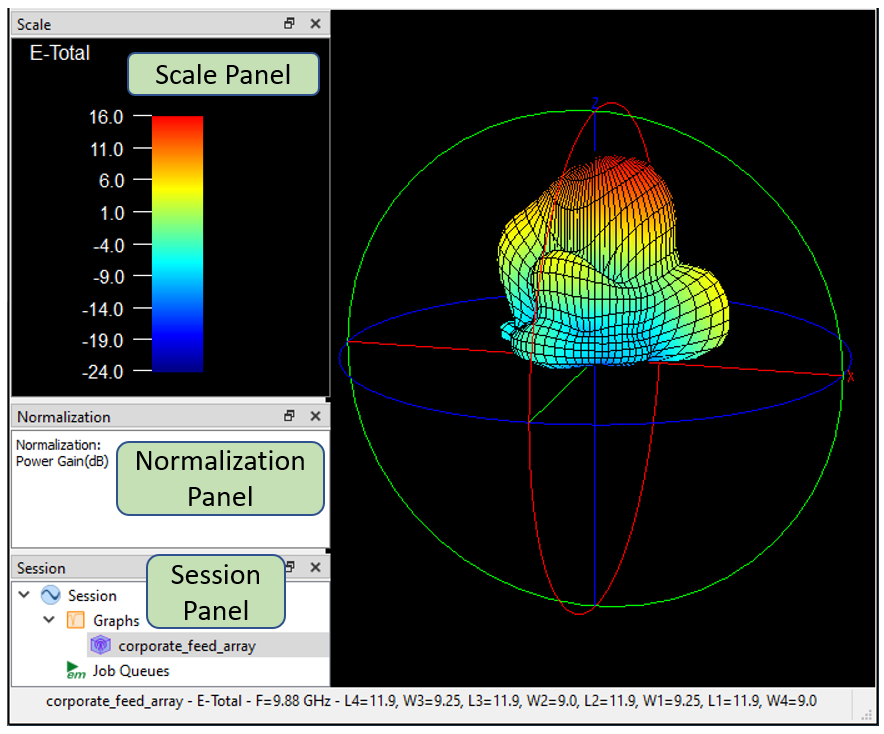 The default layout shows the Scale, Normalization, and Session panels.
Scale Panel: The Scale panel shows the color scale used for the 3D pattern. The scale is automatically set by the software.
Normalization Panel: The Normalization panel contains the type of normalization used for your plot. You may change the normalization by double-clicking the entry. See Normalization of Far Field Patterns for an explanation of the different normalization options.
Session Panel: The Session panel shows a tree view of all your presently opened tabs.
The above picture shows the default layout. To configure the layout of your tab, see Customizing Sonnet Windows for details.
Calculations
When you first open the Far Field Viewer your default Initial Graph Type is set to 3D View. The Calculations Setup dialog box automatically appears and you can set the frequency, port settings, and parameter combination you wish to use for your 3D pattern. However, if you open the 3D view from a 2D view, the 3D view will use the same calculations which were set in the 2D View. If you wish to change these settings, you may select Graph > Calculations or click the Calculations button![]() .
.
Graph options
Select Graph > Options to customize your graph. You may obtain a short description for each setting by hovering your mouse over the setting. See the descriptions below for those settings which require additional information.
Normalization: See Normalization of Far Field Patterns.
Polarization: See Polarization.
Colors: The Colors pane is available for 3D views only. It allows you to change the background color of your pattern. In addition, it allows you to change the color palette used for the color scale. The following options are available for palette choices:
- Spectrum: Spectrum follows the visible light spectrum. Red is high current density, and blue is low current density.
- Viridis: Viridis uses a perceptually uniform color map, with monotonically increasing luminance with a pleasant smooth arc through blue, green, and yellow hues. It is easier to read by those with colorblindness. It also prints well in gray scale. It was developed.by Eric Firing, Nathaniel J. Smith, and Stefan van der Walt and is in the Public Domain, CC0.
- Inferno: Inferno is a perceptually uniform color map with monotonically increasing luminance with a pleasant smooth arc through blue, purple, and yellow hues. It is easier to read by those with colorblindness. It also prints well in gray scale. It was developed by Nathaniel J. Smith and Stefan van der Walt and is in the Public Domain, CC0.
- Grayscale: Grayscale is used for black and white publications. Black is low current density, and white is high current density.
See Also