Parameter Sweeps
A parameter sweep allows you to perform a set of analyses with different variable values.
The parameter sweep capability is disabled by default. To enable parameter sweeps, select Circuit > Settings > [Analysis Plan] and select the Perform parameter sweeps checkbox. This adds a Variables section to the Sweep Set as shown in the example below.
 You may allow one or multiple variables to vary when performing a parameter sweep. To indicate which variable to sweep, check the adjacent checkbox. The variable line will become active and the parameter sweep type and value range can be specified. Shown above is an example of two variables, where one is swept and the other is held constant.
Each parameter sweep is performed at each of the frequencies defined in the sweep set's frequency entries. See Parameter Sweep Types for an explanation of each type of parameter sweep available.
Since an analysis of the circuit at each combination of variable values is executed for each specified analysis frequency, care should be taken when choosing data ranges. The higher the number of analysis frequencies and variable values, the higher the number of analyses that must be computed by the EM solver.
If the Perform parameter sweeps checkbox is not selected and the project includes variables, the nominal values will be used for the analysis.
Parameter Sweep Example
The pictures below illustrate an example of a linear parameter sweep of a circuit with a single Dimension Parameter whose value is defined as the variable "Width". The parameter sweep starts with a value of 20 mils and increases in steps of 20 until the variable’s value is 60. The EM solver will automatically perform an analysis at each specified frequency for each circuit shown below.
 To plot multiple curves on a single graph, each representing a different parameter combination, select Graph > Graph Manage Curves.In the Properties section, under Data Source, click <Select...> from the Parameters drop-down list. Then enable the parameter combinations you wish to be included on your graph. The results of the parameter sweep of this example are shown in the graph below.
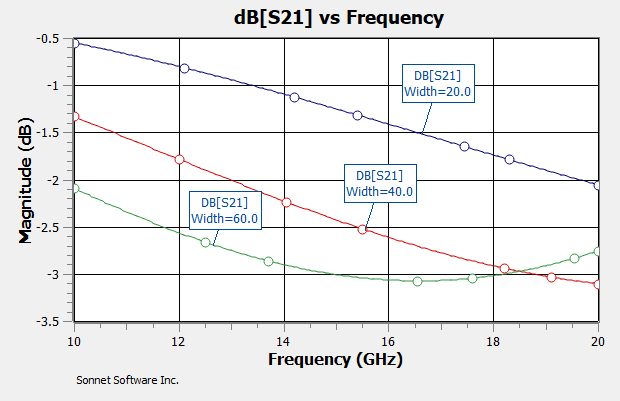
You may hover your cursor over a curve to display the parameter value. In addition, you may set up your graph to display the parameter values in the status bar when you select a curve. To do so, select Graph > Options > [Status Bar], and select Show parameters in readout.
You may also plot your results against the parameter value, "Width" by selecting Graph > Plot Over > Parameter. Shown below is the plot of the magnitude in dB of S21 versus the variable Width at 10 GHz. Data markers have been added to the plot for clarity.
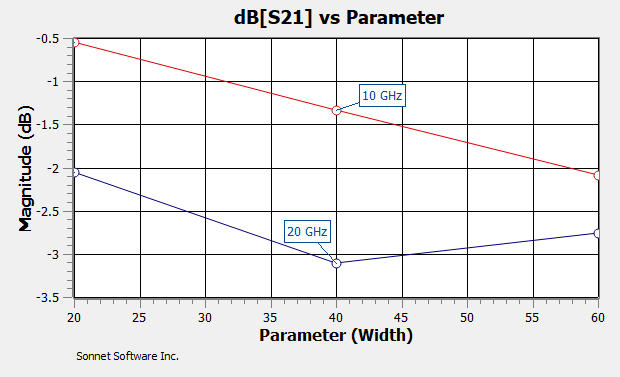
See Plotting Over Parameter for more information on plotting over a parameter value.