This tutorial shows you how to set up variables and dimension parameters in a circuit, set up and execute a parameter sweep, set up and execute an optimization and view the results of both a parameter sweep and an optimization. For a detailed discussion of parameterization and optimization, please refer to Parameterizing your Project.
This tutorial presumes that you are familiar with Sonnet Software, especially the project editor and the job queue. If you are new to Sonnet, please review the Sonnet tutorial in Getting Started before performing this tutorial.
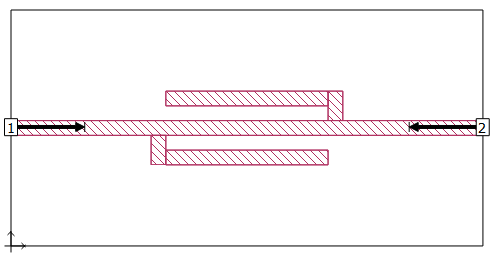
This tutorial uses the Sonnet example Par_dstub. The example may be obtained using the Sonnet Example browser.You may access the Sonnet Example browser by selecting Help ⇒ Browse Examples from the menu of any Sonnet tab. Save the example to your working directory.
This is an example of a microstrip interdigital band-stop filter. This circuit is used to perform a parameter sweep and optimization. Most parameter sweeps and optimizations will present more of a challenge, but we have deliberately chosen a simple example to more clearly demonstrate Sonnet’s methodology.
Our goal is to design the band-stop filter such that a stopband exists from 5 - 6 GHz and the passbands are from 1 - 4 GHZ and 7-10 GHz.
This tutorial covers the following topics:
Setting Up Dimension Parameters
Anchored Parameters
Symmetric Parameters
Parameter Sweep
Setting up a Parameter Sweep
Executing a Parameter Sweep
Observing the Parameter Sweep Data
Optimization
Entering the New Nominal Values
Setting Up an Optimization
Running an Optimization
Observing your Optimization Data
Accepting the Optimized Values
Setting up Dimension Parameters
Before executing either a parameter sweep or optimization, it is first necessary to add your variables and dimension parameters. Variables should be used for the properties most critical to the circuit’s response. Dimension parameters should be added to those dimensions you deem critical to the circuit’s response. These properties and dimensions are the most likely to change as the design progresses.
For this example, you will enter three dimension parameters: two anchored dimension parameters which are linked and one symmetric dimension parameter. Anchored dimension parameters are referred to as anchored parameters and symmetric dimension parameters are referred to as symmetric parameters for the rest of the tutorial.
An anchored parameter is one in which one end of the dimension parameter is a fixed point with a point set which moves in reference to that fixed, or anchored point. A symmetric parameter is one with two reference points and two point sets which move relative to the center point between the reference points.
Dimension parameters which appear in more than one place in a circuit but are of the same length and assigned the same variable are linked. Changing the value of the variable changes the length of both.
For a detailed discussion of variables and their definitions, please refer to Variables.
- Open the copy you made of the par_dstub example in the project editor.
Par_stub is displayed in the project editor.
The linked anchored parameters are input first, followed by the symmetric.
Anchored Parameters
- Select Insert ⇒ Dimension Parameter ⇒ Anchored from the project editor’s main menu.
This places the project editor in Add Anchored Parameter mode indicated by the change in cursor. Note that the message “Click to place reference point 1” appears in the status bar at the bottom of the project editor window. As you add a parameter, directions for each step appear in the status bar.
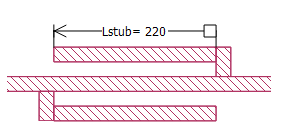
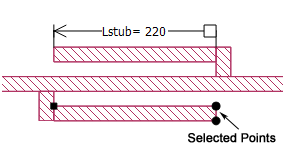
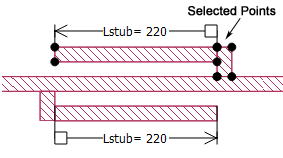
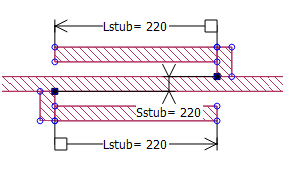
- To specify the Anchor point for the parameter, click the mouse on the corner of the upper stub, as shown in the picture below.
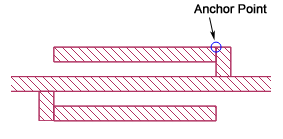
The anchor point is indicated by a small square which appears at the point you clicked. The next step is to select the reference point.
 If you select the wrong point for either the anchor or reference point, press the Escape key to exit without adding a parameter. You may then start over.
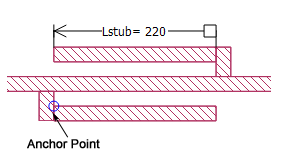
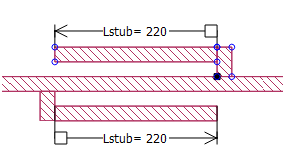
- Click on the top left end of the top stub to add the reference point.
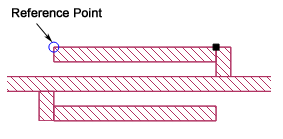
The reference point is indicated by a small square which appears at the point you clicked.
In the next step, you select the rest of the adjustable point set. Points may be selected by clicking on individual points or by lassoing a set of points with your mouse. You do not need to select the reference point since it is automatically included in the adjustable point set.
- Drag the mouse until both points on the end of the stub are selected.
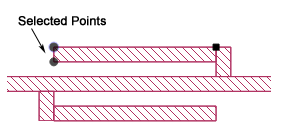
These points will be added to the adjustable point set. When the reference point moves in response to a change in the parameter value, these points move relative to the reference point.
- Once all the desired points are selected, press Enter.
This completes the dimension parameter creation. The Dimension Parameter Properties dialog box appears on your display.
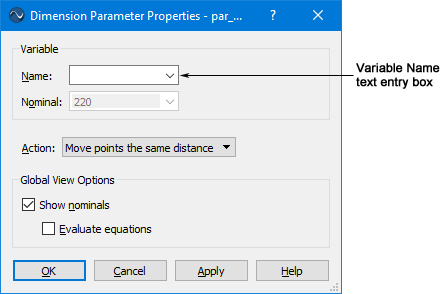
- Enter the variable “Lstub” in the Variable Name text entry box in the Dimension Parameter Properties dialog box and click on the OK button.
This assigns the variable “Lstub” to the dimension parameter. When you click on the OK button an arrow indicating the length and the name appear on your display.
- Move the mouse until the name is positioned above the stub. When the name is in the desired position, click on the mouse.
The dimension parameter should now appear as shown below.
You will now enter the linked dimension parameter. A linked dimension parameter is another dimension parameter identified in the circuit that has the same nominal value and assigned variable.
- Select Insert ⇒ Dimension Parameter ⇒ Anchored from the project editor’s main menu.
This places the project editor in Add Anchored Parameter mode indicated by the change in cursor.
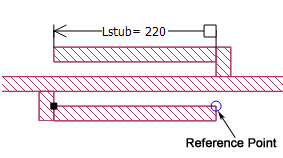
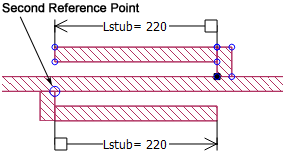
- To specify the Anchor point for the parameter, click the mouse on the corner of the lower stub, as shown in the picture below.
The anchor point is indicated by a small square which appears at the point you clicked. The next step is to select the reference point.
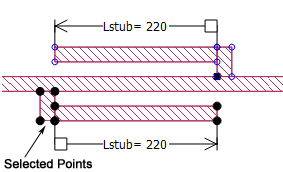
- Click on the top right end of the bottom stub to add the reference point.
The reference point is indicated by a small square which appears at the point you clicked.
In the next step, you select the rest of the adjustable point set. Points may be selected using the any of the edit commands available in the project editor.
- Drag the mouse until both points on the end of the stub are selected.
These points will be added to the adjustable point set. When the reference point moves, these points move relative to the reference point.
- Once all the desired points are selected, press Enter.
This completes the dimension parameter creation. The Dimension Parameter Properties dialog box appears on your display.
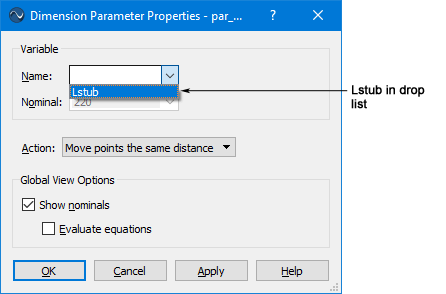
- Select the variable name “Lstub” from the drop list in the Variable Name text entry box in the Dimension Parameters Properties dialog box and click on the OK button.
Since you have already created the variable "Lstub" and this dimension parameter is the same length as the dimension parameter to which "Lstub" is already assigned, the variable name is available in the drop list.
This assigns the variable “Lstub” to the dimension parameter.
- Click on the OK button in the Dimension Parameter Properties dialog box.
When you click on the OK button an arrow indicating the length and the variable name appear on your display.
- Use your mouse to move the label to the desired location, then click.
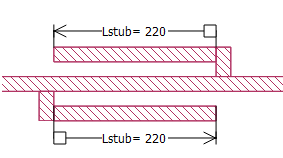
Since this dimension parameter’s nominal value is the same as the first parameter you defined, the project editor allows you to assign the same variable to both dimension parameters. These dimension parameters are now linked. A change in value of the variable changes both dimension parameters. If the dimension parameters had been of a different length, the variable name “Lstub” would not have appeared in the list. Entering the variable name manually would invoke an error message.
Next, you define the last dimension parameter which is symmetric.
Symmetric Parameters
- Select Insert ⇒ Dimension Parameter ⇒ Symmetric from the project editor’s main menu.
This places the project editor in Add Symmetric Parameter mode indicated by the change in cursor. Note that the message “Click to place reference point 1” appears in the status bar at the bottom of the project editor window. As you add a dimension parameter, directions for each step appear in the status bar and as tool tips on your screen.
- To specify the first reference point for the dimension parameter, click the mouse on the intersection of the inside of the top stub to the transmission line, as shown in the picture below.
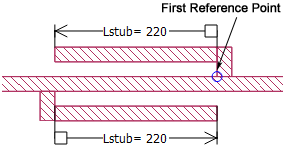
The first reference point is indicated by a small square which appears at the point you clicked. The next step is to select the point set you want attached to the first reference point.
- Drag the mouse until all points on the upper stub are selected.
These points will be added to the first adjustable point set. When the first reference point moves, these points move in the same direction and distance as the reference point.
- Once all the desired points are selected, press Enter.
This completes the first point set. The first point set is indicated by small open blue circles highlighting all the points in the set. Your circuit should look similar to this:
The message “Click to place reference point 2” appears on your display. Next, you will specify the second reference point and its point set.
- To specify the second reference point for the parameter, click the mouse on the intersection of the inside of the bottom stub to the transmission line, as shown in the picture below.
The second reference point is indicated by a small square which appears at the point you clicked. Note that the first point set continues to be identified by small blue circles on all its points. The next step is to select the point set you want attached to the second reference point.
- Drag the mouse until all points on the lower stub are selected.
These points will be added to the second adjustable point set. When the second reference point moves, these points move in the same direction and distance as the reference point.
- Once all the desired points are selected, press Enter.
This completes the second point set and the symmetrical parameter. The Parameter Properties dialog box appears on your display.
- Enter the name “Sstub” in the Variable Name text entry box in the Parameter Properties dialog box and click on the OK button.
This assigns the variable “Sstub” to the dimension parameter. When you click on the OK button an arrow indicating the length and the variable name appear on your display. Note that since there is a difference between the reference points in both the x (horizontal) and y (vertical) direction, you may move the parameter name so that the parameter is defined in either the x or y direction.
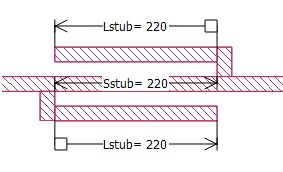
If you were to choose the y direction, moving the mouse to the left or right of both reference points to define your parameter, it would appear like this:
However, for this example, you define the parameter in the x direction, moving your mouse up or down, above or below both reference points.
- Move the mouse until the name is positioned in the middle of the thru line. When the name is in the desired position, click on the mouse.
This sets the dimension parameter in the x direction. The dimension parameter should now appear as shown below.
This completes entering the dimension parameters. Note that Lstub is affected by Sstub. As Sstub increases, although it does not directly affect the value of Lstub, the two stubs do get further apart. The dimension parameter to which Lstub is assigned is dependent on the dimension parameter to which Sstub is assigned. However, the variable Lstub is NOT dependent on the variable Sstub so that both are available to be selected for the parameter sweep and optimization covered later in this tutorial. Only independent variables may be selected for parameter sweeps and optimization.
- Select File ⇒ Save for the project editor main menu.
This saves the changes you have made to the circuit so that you can analyze it.
The next section of the tutorial teaches you how to setup and run a parameter sweep on the circuit.
Parameter Sweep
The parameter sweep uses only the Lstub variable. You analyze the circuit at two different lengths for Lstub over a frequency band of 2.0 GHz to 10.0 GHz. When the sweep is complete, you view the response curves in the response viewer.
For a detailed discussion of a parameter sweep, please refer to Parameter Sweep.
Setting Up a Parameter Sweep
- Select Circuit ⇒ Settings from the project editor main menu.
You may also click on the Settings icon  in the tool bar to open the dialog box. The Circuit Settings dialog box appears on your display.
- Click on Sweeps in the side bar menu of the Circuit Settings dialog box.
The appearance of the dialog box is updated with the sweeps page. Note that the Analyze with Sweeps radio button is selected, so that all of the controls on this page are enabled.
- Select the Perform parameter sweeps checkbox.
When this checkbox is selected, a variable section is added to the default sweep set which allows you to select the variables you wish to use in the parameter sweep and define the type and range of values.
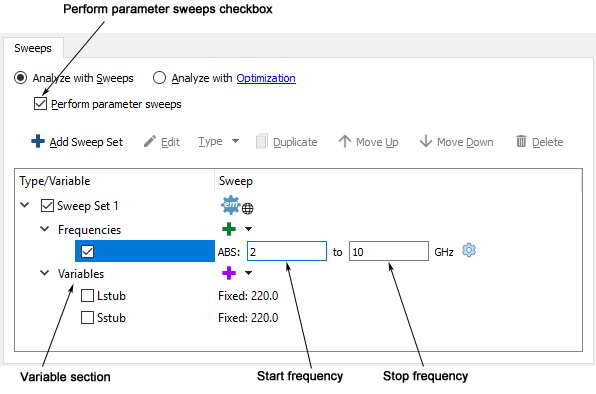
An ABS sweep from 4 to 8 GHz has already been added to the example. Since we wish to analyze from 2.0 GHz to 10 GHz, the Start and Stop frequency need to be changed.
- Enter 2.0 in the Start Frequency text entry box and 10.0 in the Stop Frequency text entry box.
This defines a band of 2 GHz to 10 GHz for the adaptive sweep.
Next, you will select the variables you wish to sweep.
- Click on the checkbox in the Variable section for the Lstub variable.
When the variable is selected, the entry is changed from Fixed to Lin. A linear variable sweep is the default. To select another type of sweep, you may click on the Parameter sweep drop list and select another type. The default mode of Linear Sweep is used for this example so there is no need to take any action. For details on sweep modes, please see Parameter Sweeps.
It is possible to select multiple variables for a parameter sweep; however, for this example, only one variable is used. If you wished to deselect the variable, you would simply click on the checkbox again. Unchecked variables are simulated at their nominal value, so Sstub is a constant, fixed at 220 mils for the parameter sweep.
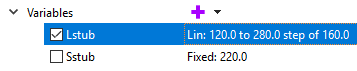
- Double-click on the Lstub variable entry to edit the sweep entry.
The entry boxes for a the starting value, end value and step size are displayed.
- Enter 120 in the Start text entry box in the Lstub row.
This sets 120 mils as the first variable value used for Lstub. Note that the nominal value of Lstub is still 220 mils which is the length displayed in the project editor window.
- Enter 280 in the Stop text entry box in the Lstub row.
This sets 280 mils as the last variable value used for Lstub.
- Enter 160 in the Step text entry box in the Lstub row.
The interval between variables is 160 mils; therefore, this parameter sweep analyzes at two variable values, 120 and 280 mils. The entry should appear as shown below:
This completes the setup for the parameter sweep entry. In this case, since there are two values for a single variable, there are two parameter combinations. Each combination is analyzed at each analysis frequency.
For example, you have two variables, the first has seven values and the second has eleven values. In that case, there would be 77 variable combinations for the analysis.
- Click on the OK button of the Circuit Settings dialog box.
Next, you run the analysis and use the analysis monitor to observe the progress.
Executing a Parameter Sweep
- Select Launch ⇒ Analyze ⇒ New Queue from the project editor’s main menu to invoke the analysis engine, em, and start the analysis.
If you are prompted, save the file.
f you have any remote servers defined, the Select Server dialog box appears. Select the server you wish to use for the analysis. The job queue is assigned to the selected server and any subsequent jobs added to this job queue will be run on the selected server. If you do not have any remote servers defined, the job queue is automatically assigned to your local computer. Once the analysis server is selected, a new job queue tab is opened in the Sonnet session window, with the job par_stub listed in the job queue.
If the Queue type is set to manual, then the job par_dstub is listed in the job queue but the analysis does not start running. The  icon appears before the job entry to indicate this.
If your queue type has previously been changed to auto, the analysis starts running immediately, indicated by the  icon before the job entry in the job queue.
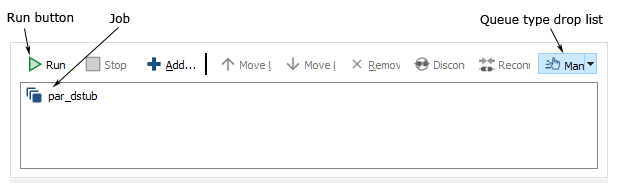
- If the job does not start automatically, click on the Run button to start the analysis.
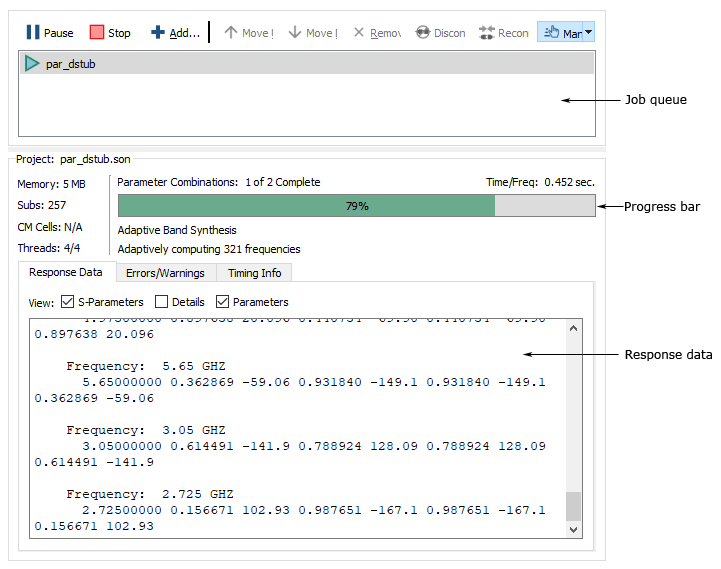
The job queue tab allows you to observe the analysis as it progresses. There is a progress bar just below the job queue which shows what percentage of the total analysis is complete with the number of parameter combinations analyzed appearing above it. While the analysis is running, the progress bar is displayed in green. The response data is output in the Response data tab at the bottom of the window.
The analysis could take a few minutes to run depending on your computer.
Once the analysis is complete, the  icon appears before par_dstub in the job queue indicating the analysis is complete. The progress bar is now displayed in blue. Next, you open the response viewer to look at your results.
Observing the Parameter Sweep Data
You want to see the data for the S21 response at Lstub = 120 mils and Lstub = 280 mils.
- Select Launch ⇒ Graph Response ⇒ New Graph from the main menu of the job queue tab.
A new response viewer tab is opened in the Sonnet session window, displaying the default S11 curve.
- Double-click on the DB[S11]-par_dstub entry in the curve list.
The Manage Curves dialog box appears on your display with the DB[S11] curve selected. Since we want to plot S21 there is no need to make any changes in the Measurement section of the dialog box; "S-Parameters" is already selected.
- Click on the "To Port" entry under Properties to place it in Edit mode.
A small down arrow for the control drop list appears.
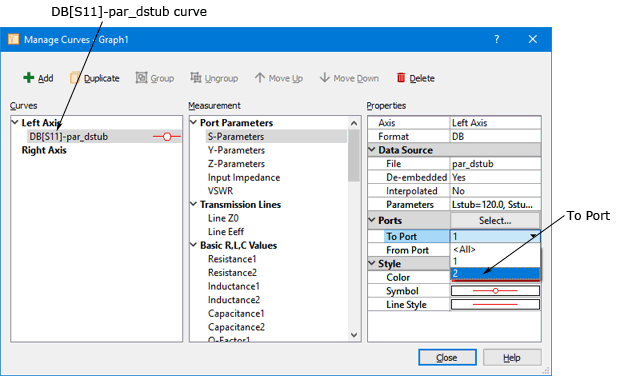
- Select "2" from the drop list.
This defines the S-parameter as S21. Note that when you changed the to port value, the name of the curve was updated to DB[S21]-par_dstub.
- Click on the Parameters entry under Properties to place it in Edit mode.
A small down arrow for the control drop list appears.
- Select <Select...> from the Parameter drop list.
The Select Parameters dialog box appears on your display.
- Select the check box for Lstub = 280.
The entry for Lstub = 120 was already selected by default.
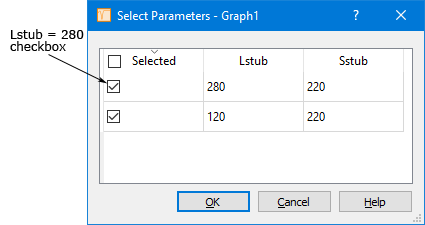
- Click on the OK button in the Select Parameters dialog box to close the dialog box and apply the changes.
The Parameters entry now displays "Mixed" since more than one combination is selected.
- Click on the Close button in the Manage Curves dialog box.
The dialog box is closed. The appearance of the plot has been updated to include the S21 response for Lstub = 120 and Lstub = 280. The graph should be similar to the one shown below.
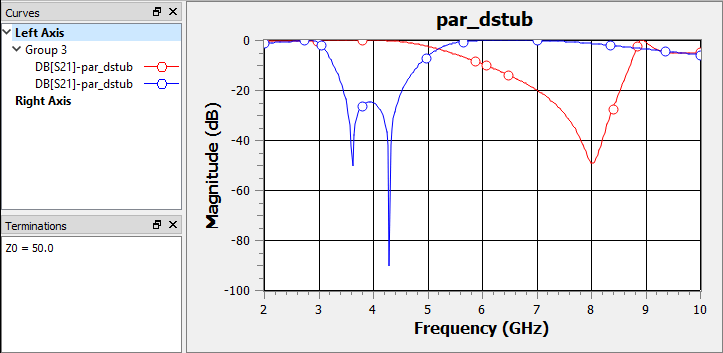
In the beginning, the goal of the filter design was stated as a stopband between 5.0 and 6.0 GHz. By looking at the graph of Lstub=120 as compared to Lstub=280, you can see that a filter with the required stopband would fall approximately in the middle of the two curves. So a value of 220 mils is chosen for the nominal value for Lstub for the optimization. A nominal value of 200 mils is chosen for Sstub.
Optimization
This next section of the tutorial shows how to set up and execute an optimization. For a detailed discussion of optimization, please refer to Optimization.
Entering the New Nominal Values
Usually for this type of circuit, you would optimize using both of the defined parameters, Lstub and Sstub, but for the sake of processing time, the optimization only uses one parameter, Lstub.
The nominal value used for Sstub will be 200 mils. This was arrived at by actually executing the optimization using both parameters and using the closest value on the grid of the optimized parameter.
- .Click on the Edit tab in the Sonnet session window to return to the project editor.

The session window is updated to display the project editor view of your circuit.
- Double-click on the parameter Sstub in the circuit.
The Dimension Parameter Properties dialog box for Sstub appears on your display.
- Change the nominal value in the Nominal text entry box to 200.
- Click on the OK button to close the dialog box and apply the new nominal value.
The circuit is redrawn using the new nominal value for Sstub.
It is recommended that you change the nominal value of dimension parameters by using the properties dialog box, since changing your nominal value this way does not affect any previous response data in your project file. If you change the nominal value of the dimension parameter by changing the circuit through editing commands, such as a reshape, all previous response data is deleted from the project file when you save.
Setting Up an Optimization
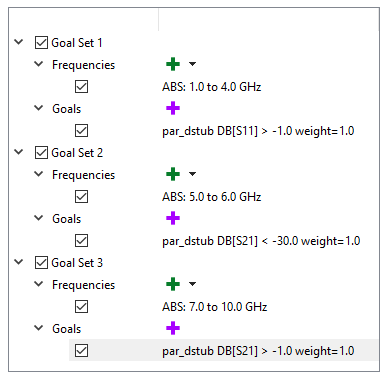
As mentioned earlier in the example, our goal for the filter is to have passbands at 1-4 GHz and 7-10 GHz with a stopband at 5-6 GHz. The optimization goal sets are set up accordingly. A goal set allows you to define a set of frequency sweeps and goals for optimization. Since the goals are each defined for a different frequency band, you will create three goals sets, each with one goal. Since all three goals in this case are equally important, each goal uses the default Weight of 1.0. In cases where one goal is more essential, assigning it a higher weight than other goals tells em to concentrate more on reaching that particular goal. For more information about assigning a weight to a goal, see Weight Factor.
- Select Circuit - Settings from the main menu of the project editor.
The Circuit Settings dialog box appears on your display.
- Click on Optimization in the side bar menu of the Circuit Settings dialog box.
The appearance of the dialog box is updated to display the Optimization page.
- Select the Analyze with Optimization radio button.
This selects a optimization as the type of analysis and enables the controls on the Optimization page.
- Click on the Add Goal Set
 button in the Optimization page.
A Goal Set is added to the empty list below.
- Click on the Frequencies drop list and select Adaptive Sweep (ABS) from the drop list.
An entry for an adaptive sweep is added to the Frequencies section of the goal set. The first goal corresponds to the first passband; therefore, you need to set the ABS frequency range to 1.0 GHz to 4.0 GHz.
- Enter 1.0 in the Start Frequency text entry box and 4.0 in the Stop Frequency text entry box.
This defines a band of 1.0 GHz to 4.0 GHz for the adaptive sweep. This completes the specification of the frequency sweep for this optimization goal set.
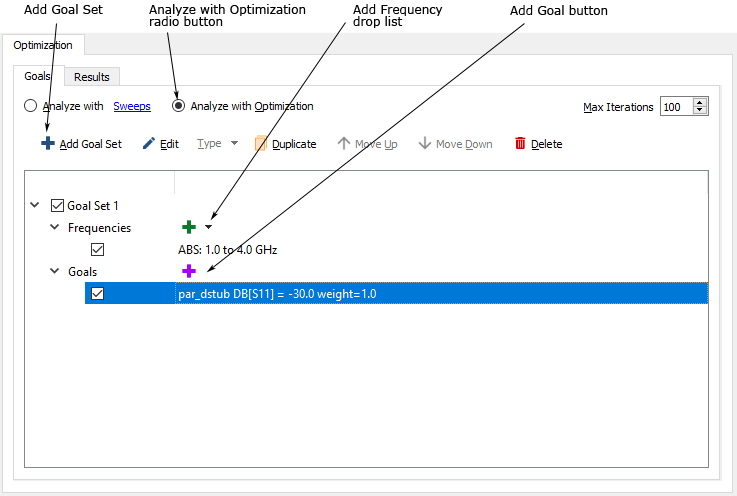
- Click on the Add Goal button (purple plus sign) next to the Goals section to add an entry for a goal.
A default goal entry is added to the Goals section.
- Double click on the Goal Entry.
The Goal Editor dialog box is opened on your display. This dialog box allows you to edit the goal.
Since this is the first passband, your goal is to have DB[S21] be greater than -1.0 dB.
- Select DB from the Response Type drop list on the left side of the equation.
This is the default, so DB may already be selected.
- Select S21 from the Response drop list.
The display is updated with “S21.”
- Select “>” from the Operand drop list.
The display is updated with “>.”
- Select Value from the Goal Type drop list.
This choice allows you to put in a specific value. This is the default; you may also specify another project file or another network in your project (if the project is a Netlist project). In those cases, you may select a response for that circuit to which you wish to match your selected response.
- Enter -1.0 in the Value text entry box.
This sets your goal of DB[S21] > -1.0 dB. As noted earlier, each goal is assigned a weight of 1.0, so the default value is used and no change needs to be made.
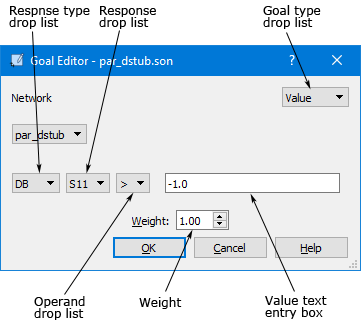
- Click on OK to apply the changes and close the dialog box.
An entry for this optimization goal now appears in the Goals section of Goal Set 1 as pictured below.
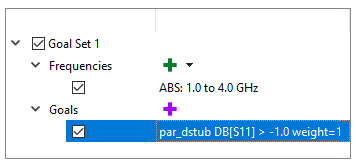
The other two goals should be entered in a similar manner. The second goal is a adaptive sweep from 5.0 GHz to 6.0 GHz with a desired response of DB[S21] < -30.0 dB. This is the stopband. The third goal is an adaptive sweep from 7.0 GHz to 10.0 GHz with a desired response of DB[S21] > -1.0. When you have completed entering these goals, the Goals list should appear as shown below.
Next, you will define the variables used for the optimization. Only one variable, Lstub, is used for this optimization. The range for Lstub is 100 mils to 300 mils.
- Click on Variables in the sidebar menu of the Circuit Settings dialog box.
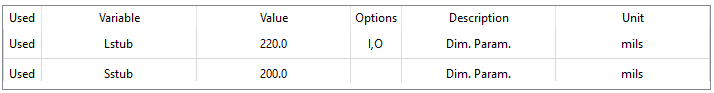
The appearance of the dialog box is updated to display the Variables page. The list of variables includes the two variables you defined, Lstub and Stub. Both entries say used since both variables are assigned to a dimension parameter.
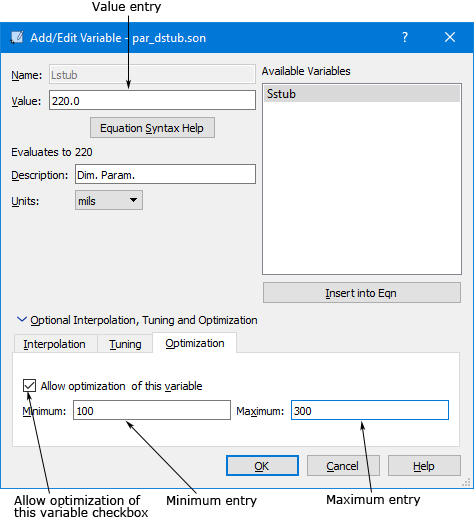
- Double-click on the Lstub entry to edit it.
The Add/Edit Variable dialog box is opened. Note that you may not edit the name since you are editing a variable.
- Click on the Optimization tab at the bottom of the Add/Edit Variable dialog box.
The appearance of the dialog box is updated to display the Optimization controls for Lstub.
- .. Select the Allow optimization of this variable checkbox.
This selects the Lstub variable to be used in the optimization. Note that the nominal value appears in the Value text entry box above. If you wish to change the nominal value, you may do so by entering a new value. The circuit will be redrawn using the new nominal value. Since this is the first optimization run on this project file the Minimum and Maximum entries are blank. If a previous optimization had been run, the last entered values would remain.
Editing parameter settings or optimization goals causes any pre-existing optimization iterations to be deleted from the project file.
- Enter 100 in the Minimum text entry box in the Optimization tab.
This sets the minimum value for the Lstub variable to 100 mils for the optimization.
- Enter 300 in the Maximum text entry box in the Optimization tab.
This sets the maximum value for Lstub to 300 mils for the optimization.
- Click on the Interpolation tab in the Add/Edit Variable dialog box.
The dialog box appearance is updated to display the Interpolation tab.
- Select the Interpolate this variable checkbox.
This enables the variable for interpolation. When interpolation is enabled, a set of values is defined at which the analysis engine, em, performs a full electromagnetic simulation. For all other values, em performs a linear interpolation to calculate the response. Interpolation should always be turned on when optimizing since it reduces the number of frequencies at which a full analysis needs to be performed and reduces processing time.
- Click on the OK button to apply the changes and close the dialog box.
When the dialog box is closed, the Lstub entry in the Variables page of the Circuit Settings dialog box is updated and now displays an "I,O" in the Options field indicating that it is selected for Optimization and Interpolation.
Now that you have identified which variable to vary and its range, this completes the setup for the optimization.
Running an Optimization
This optimization took approximately 2.5 minutes on a 3.5 GHz Intel i5.
- Select Launch ⇒ Analyze ⇒ Add to <server name> from the main menu of the project editor.
The job is added to the existing job queue and the session window is updated to display the job queue. Again, if the queue type is manual, you will need to click on the Run button to start the analysis.
You may observe the optimization as it progresses. The initial error as well as the error for the present and best iteration are displayed and updated as the optimization progresses. The response data is output in the bottom of the window.
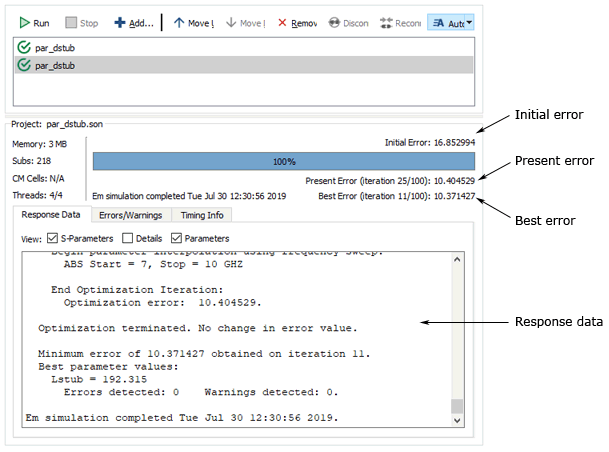
You may notice that some iterations complete more quickly than others. This is because em can reuse portions of the response data calculated for previous iterations.
Once the analysis is complete, you open the response viewer to look at your results. Be aware that since this optimization took a number of iterations to conclude, there may be small delays in opening the response viewer and the Manage Curves dialog box.
You may use the response viewer to observe data produced by the optimization while it is still running. The response viewer can chart any data which has been generated. This allows you to stop the optimization and start it over using new variable ranges or new goals, if the results are not desirable. If you wish to continue viewing data as the optimization runs, use the Graph Refresh command in the response viewer tab.
Observing your Optimization Data
Plotting the best iteration will allow you to judge whether or not to use the optimized values of the parameters.
- Select Launch ⇒ Graph Response ⇒ New Graph from the main menu of the job queue tab.
A new graph tab appears in the Sonnet session window with the DB[S11] response for the nominal values parameter combination displayed. There may be some delay while the project loads into the response viewer due to the amount of response data now included.
- Double-click on the DB[S11]-par_dstub entry in the curve list.
The Manage Curves dialog box is opened with the DB[S11] curve selected. Since your optimization goals used S21 you wish to plot that S-parameter.
- Click on the "To Port" entry under Properties to place it in Edit mode.
A small down arrow for the control drop list appears.
- Select "2" from the drop list.
This defines the S-parameter as S21. Note that when you changed the to port value, the name of the curve was updated to DB[S21]-par_dstub.
- Click on the Parameters entry under Properties to place it in Edit mode.
A small down arrow for the control drop list appears.
- Select "2" in the To Port field drop list.
This defines the S-parameter as S21. Note that when you changed the to port value, the name of the curve was updated to DB[S21]-par_dstub.
- Click on the Parameters entry under Properties to place it in Edit mode.
A small down arrow for the control drop list appears.
- Select <Best Opt Error> from the Parameter drop list.
Select Best Opt Error displays the parameter combination that produced the lowest error. The Parameters entry is updated with the parameter combination, Lstub=192.315, Sstub=200, which is the parameter combination that produced the lowest error during the optimization.
- Click on the Close button to close the Manage Curves dialog box.
The plot is updated showing DB[S21] for the best iteration. It should appear similar to the plot pictured below.
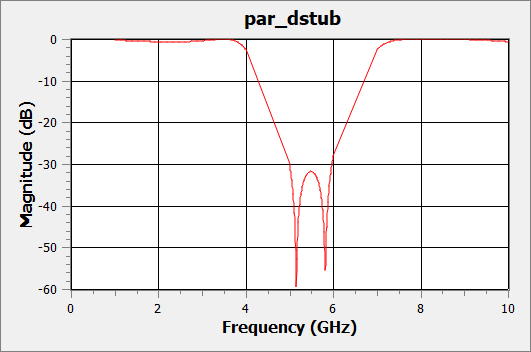
As you can see, the optimized circuit is producing the desired response of a stopband from 5 - 6 GHz and the passbands from 1 - 4 GHZ and 7-10 GHz.
Accepting the Optimized Values
Since the desired responses have been achieved by the optimization, you return to the project editor to update the nominal value of your parameters with the optimized values.
- Click on the Edit tab in the session window to return to the project editor.
The session window is updated to display the 2D view of par_dstub.
- Select Circuit ⇒ Settings from project editor main menu.
The Circuit Settings dialog box is appears on your display.
- If it is not already selected, click on Optimization in the side bar menu of Circuit Settings dialog box.
The dialog box is updated to display the Optimization page.
- Click on the Results tab in the Optimization page.
The appearance of the dialog box is updated to display the Results tab. There is an entry for the variable Lstub that was used in the Optimization. Notice that the nominal value of Lstub is still the value input at the beginning of the optimization. But the optimization result for the variable is displayed in the last column.
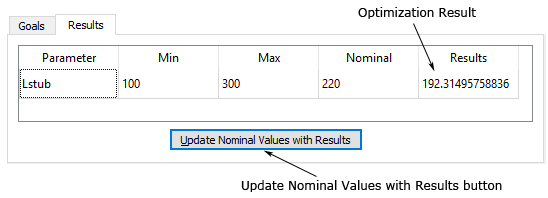
- Click on the Update Nominal Values with Results button to replace the present nominal value of Lstub with the optimization result.
Note that the entry in the Nominal column is updated with the optimized value.
- Click on OK to close the dialog box and apply the changes.
Notice that the circuit has been redrawn with the new nominal value for the Lstub dimension parameters. Since the parameter lengths are not integer multiples of the cell size, the polygons are no longer exactly on the grid. You can see this by pressing Ctrl-M to turn off the cell fill and looking at the actual polygons. The cell fill represents the actual metal em analyzes.
The actual metalization analyzed by em is not the same as the optimized values. Em actually interpolated from data created from analyzing “on grid” versions of the circuit. If your optimization goals did not include a full frequency sweep, it is a good idea to perform a full sweep across your frequency band to ensure that your entire band shows reasonable results. Running a full frequency sweep is detailed below.
In order for em to use previously calculated response data, you should edit your variable value(s) such that they are the closest “on grid” value to the optimization result. For example, in this case the optimized value for Lstub is 192.3150. You should edit the nominal value of Lstub to change it to 190 which, since the cell size is 10, is on the grid.
- Select Circuit ⇒ Settings from the project editor main menu.
The Circuit Settings dialog box appears on your display.
- Click on Sweeps in the side bar menu of the Circuit Settings dialog box.
The appearance of the dialog box is updated to display the sweeps page.
- Click on the Analyze with Sweeps radio button.
The controls on the Sweeps page are enabled.
- ..Clear the Perform parameter sweeps checkbox.
The sweep set entry is updated to remove the variable section since you will not be performing a parameter sweep. The entry now defines an ABS sweep from 2.0 GHz to 10.0 GHz.
- Click on OK to close the dialog box and apply the changes.
- Select Launch ⇒ Analyze ⇒ Add to <server name> from the project editor main menu.
If prompted, save the circuit before analyzing. The session window is updated to display the job queue tab. Your previous completed jobs are listed in the job queue and this job is added to the bottom of queue. If the analysis does not start automatically, click on the Run button.
- When the analysis is complete, click on the Graph button in the tool bar of the job queue tab.
A third graph tab is added to the session window.
- In the same manner as earlier in the tutorial, change the curve being plotted to DB[S21] for the parameter combination Lstub = 190, Sstub = 200.
Your plot should appear similar to that shown below.
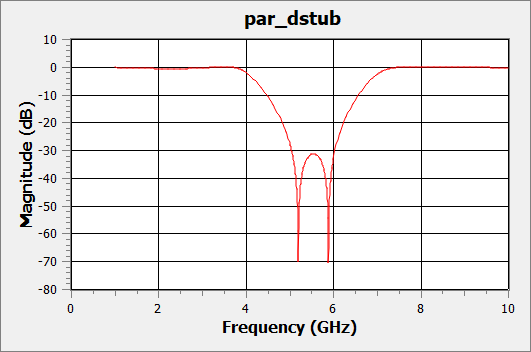
The results conform closely enough to the design criteria that this optimization is considered a success. As was stressed at the beginning of this tutorial, a simple example was chosen in order to clearly demonstrate the optimization process.
You should be aware, however, that most optimization problems are much more complicated and less straightforward. The designer needs to make decisions about parameters, the parameter sweeps and optimization goals based on knowledge of the circuit and design experience. Often, you must observe an optimization while in progress, judge its viability and, as necessary, stop the optimization and start a new one with new nominal values and data ranges.