2D Patterns
This topic explains the settings for a 2D Far Field pattern. Both Cartesian and Polar far field patterns are available. Shown below is the Far Field Viewer tab using the default window layout.
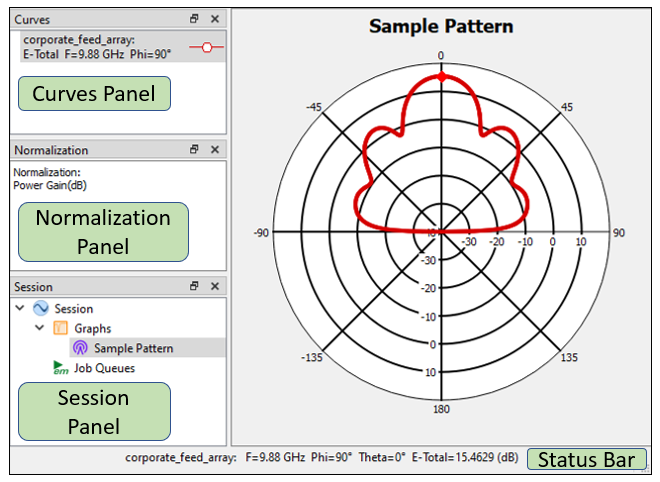 Three panels and the Status Bar are shown by default:
Curves Panel: The Curves panel lists all of curves presently plotted on your graph. Curves are added to your plot by selecting Graph > Manage Curves from the main menu or double-clicking on any entry in the Curves panel. See Manage Curves for more details.To delete a curve, right-click on the curve entry and select Delete from the pop-up menu, or select the curve and press the Delete key.
Normalization Panel: The Normalization panel contains the type of normalization used for your plot. You may change the normalization by double-clicking the entry. See Normalization of Far Field Patterns for an explanation of the different normalization options.
Session Panel: The Session panel shows a tree view of all your presently opened tabs.
Status Bar: When you click a point on your pattern, the Status Bar shows details about the point. You may customize the status bar by selecting Graph > Graph Options > [Status Bar].
The above is just the default configuration. You may configure the layout of your tab in any way that you wish. See Customizing Sonnet Windows for details.
Manage Curves
Selecting Graph > Manage Curves from the main menu opens the Manage Curves dialog box. This dialog box allows you to manage the curves in your plot.
Also, you may open the Manage Curves dialog box by clicking the Curves toolbar button  .
.
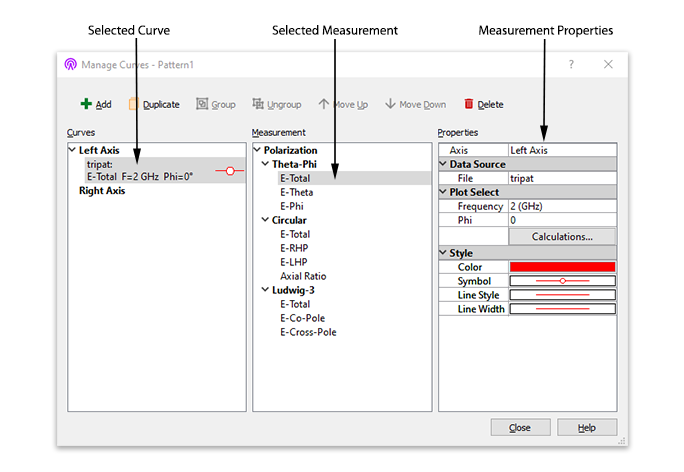
There are three sections in the Manage Curves dialog box: Curves, Measurement, and Properties. The dialog box is designed so that you start on the left and move to the right. You select or add a curve in the left panel. Then, you select the desired measurement for that curve in the middle panel. Finally, you input the measurement's properties in the right panel.
Selections made in the Measurement and Properties sections affect the presently selected curve(s). The appearance of the Properties section is updated depending on the selection in the Curves or Measurement section.
Curves Section
The Curves section allows you to add, delete, group, and change the order of curves. You may use the Shift and Ctrl keys to select multiple curves.
Measurement Section (Polarization)
The Measurement section defines the polarization used in the presently selected curve in the Curves section. See Polarization for a description of the available choices.
Properties Section
The appearance of the Properties section is updated depending on the selection in the Curves or Measurement section. Each portion of the Properties section is described below.
Axis (Cartesian graphs only)
This Axis drop-down list determines on which axis the curve appears on a Cartesian graph.
Data Source
The Data Source section determines the source file and the parameter combination used for the curve.
- File: The File drop-down list contains a list of the files which have been opened. To add more files, close the Manage Curves dialog box and select File > Add to Graph. You may also remove any unused files from the drop-down list by closing the Manage Curves dialog box and selecting Graph > Remove Unused Sources. Any file which is not being used in your graph will be removed from memory.
- Parameters: The Parameters drop-down list contains a list of parameter combinations available. To add more parameter calculations, click the Calculations button in the Plot Select portion of the Properties section. If you are plotting over a parameter, you may change the variable over which you are plotting by Clicking <Select...> from the drop-down list and choosing a different variable from the Plot over Variable drop-down list.
To plot vs. a parameter value, select Graph > Plot Over > Parameter from the main menu.
Plot Select
The Plot Select section defines the properties used in the presently selected curve in the Curves Section. This section contains fields for frequency, phi, and theta, or any combination of the three, depending on what you are plotting over. In all cases, you may use the drop-down menu to change any of these values. In addition, you may choose <Manage> from the drop-down list which opens a dialog box allowing you to select any combination of values. To add more frequencies, angles, or parameters to your collection, click the Calculations button.
Graph options
Click Graph > Options to customize your graph. You may obtain a short description for each setting by hovering your mouse over the setting. See the descriptions below for those settings which require additional information.
- Units: The Units pane allows you to control the units used in your graph. The frequency units are the only units that would affect your graph.
- Markers: See Graph and Pattern Markers for more information.
- Normalization: See Normalization of Far Field Patterns.