Graphs Overview
You may graph Sonnet results as either a Cartesian graph or Smith chart by opening a Graph tab. For Cartesian graphs, you can graph S, Y, and Z-parameters and equations that are derived from the S, Y, or Z-parameters, such as inductance and Q-factor. Multiple projects can be plotted on a single graph, and S-parameter files from measurement systems can also be added to the same graph.
In addition, if you use Sonnet to perform a parameter sweep or an optimization, you can graph your results as a function of the swept parameter. See Parameterization Overview and Tuning a Curve for details.
You may graph your results even while an analysis is running, provided at least one data point has been calculated. You may then refresh your graph as the EM analysis completes more data points.
Opening a Graph Tab
You may open a new Graph tab using any of these methods:
- Click the Graph Response button in the Session tab
- Select File > Graph Response from the main menu in the Session tab.
- Click the Graph button in the Launch toolbar of any tab other than the Session tab. This opens a graph of the project that is open or selected.
- Select Launch > Graph Response from the main menu of any tab other than the Session tab. This opens a graph of the project that is open or selected.
- Windows Only: Right-click on a project file in File Explorer, then select View Response from the pop-up menu which appears.
- Whenever you open a new graph for a project, you may set your project to open one more more graph templates. Select Circuit > Settings > [Startup Graphs] from the Project Editor tab.
Startup Graphs override any New Graph or New Pattern settings. See Startup Graphs for an explanation of Startup Graphs.
Graph Tab Window
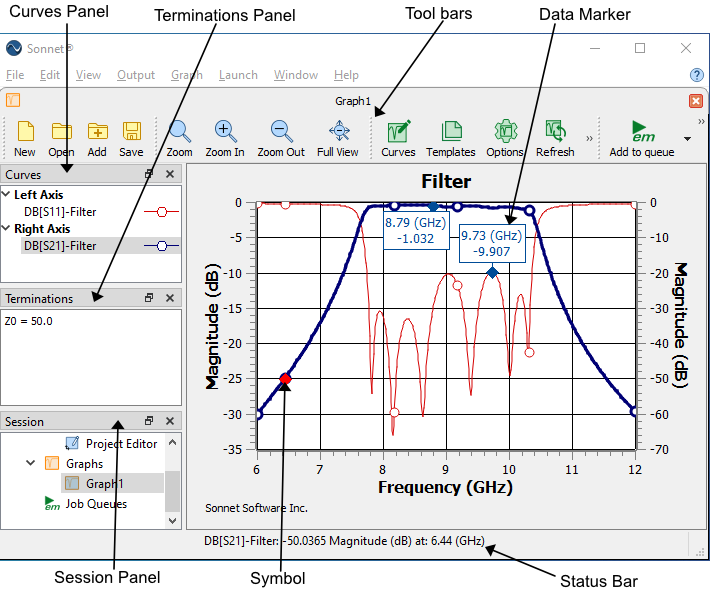
The following picture illustrates the various sections of a Graph tab window.
 The default configuration is shown above. You may configure the layout of your window in any way that you wish. See Customizing Sonnet Windows for details.
The following is a list of the various sections of the Graph tab window:
- Toolbars: Toolbars contain buttons that are shortcuts to menu commands. Hover your mouse over a toolbar button for a brief description.
- Curves Panel: The Curves panel lists all of curves presently plotted on your graph. Curves are defined and/or added to your graph by selecting Graph > Manage Curves from the main menu, or double-clicking a curve identifier in the Curves panel. See Manage Curves Dialog Box (Graphs) for more details. To delete a curve, select the curve and press the Delete key. Also, you may right-click in the Curves panel and a pop-up will appear. The pop-up is specific to what is selected.
- Terminations Panel: The Terminations panel lists the termination impedance (also called "normalizing impedance", or "Z0") for the ports presently used in your graph. If the same impedance is being used for all the ports, there is only one entry defining the impedance for all the ports. If the impedances are not the same for all ports, then the word "Multiport" appears in the panel and the termination impedance of each port is displayed. To change the termination impedances for your graph, see Graph Options.
- Session Panel: The Session panel shows a tree view of all your presently opened tabs.
- Status Bar: When you select a point on a curve, the Status Bar shows details about the point. You may customize the status bar by selecting Graph > Graph Options > [Status Bar].
- Symbols: By default, symbols are placed on discrete data points. You may disable or enable symbols for your entire graph by selecting View > Symbols or Graph > Graph Options > [General] and unselecting/selecting the Symbols checkbox. The symbol shape is a property of the curve and may be customized in the Manage Curves dialog box (Graph > Manage Curves).
- Markers: Markers allow you to mark up your graph to more clearly evaluate your Sonnet results or to aid in a presentation of your data. See Graph and Pattern Markers for details.
- Legend: A legend may also be added to your graph (not shown in the picture above). Select View > Legend or Graph > Graph Options > [General] and select the Legend checkbox. An example of a legend is shown below.

Graphing Multiple Projects or Files
To graph more than one project on a single graph, or to add S-parameter files to an existing graph, select File > Add to Graph. A curve or curves will be added to your graph using the same measurements as the existing curves. For example, if your graph contains a curve showing the magnitude of S21, and you add a new project, a new curve of the magnitude of S21 of your new project will be added to your graph.
Saving a Graph
Select File > Save to save the presently displayed graph to a graph file. To open a previously saved graph file, select File > New Graph.
A graph file contains all information to reproduce your graph. However it does not contain the actual data plotted. Instead, it contains relative paths to the files that contain the data. When you open a graph file, the referenced projects must be present in the same relative path that they were when you saved the graph.
Graph Options
Select Graph > Graph Options to open the Graph Options dialog box. This dialog box allows you to control the appearance of your graph. You may obtain a short description for each setting by hovering your mouse over the setting. See the descriptions below for those settings which require additional information.
General: Allows you to control the appearance of your graph, including the title, legend, grid, symbols, axis, and markers.
Markers: See Graph and Pattern Markers for more information.
Terminations: Allows you to set the termination impedance for all the ports used in your graph. By default, the first project file you load determines the impedances of your graph. All projects and files in your graph must use the same settings. By default, the Multiport check box is unselected. This means that settings are applied to all ports. To specify different values for each port, select the Multiport checkbox. For a detailed discussion of port terminations, see Port Termination Impedance.
Remember settings: By default, the Remember Settings checkbox is selected. This means that any changes made in the Graph Options pane apply to the existing graph and all future graphs. To make a temporary change which affects only the present graph, unselect this checkbox or use the options available in the View menu.
Exporting Models and Data
You may generate an output file from a Sonnet graph using the Output menu. See Output Files - Overview for details.
Tuning a Curve
Sonnet's Tuning feature allows you to change a variable and immediately see the effects of that change on a curve, or curves in a graph. See Tuning a Curve for more details.