Tutorial: View Current Density
In this part of the tutorial, you will view the current density of your project. The Current Density tab displays the Current Density Viewer, which is a visualization tool used to view results from an EM analysis as a color shaded plot. The colors can represent the magnitude or phase of current density or charge. Both 2D and 3D views are available. It is also possible to animate your results as a function of frequency or time.
The Current Density Viewer requires a Current Density Viewer license.
Open Example File
This page assumes you have already analyzed the project file part3_finalized.sonx with Compute currents enabled. If you have not, you may use the example file provided with your Sonnet installation. Click the triangle below to expand the instructions for obtaining the example file.
Obtaining the Example FileObtaining the Example File
To obtain the example file, follow these instructions.
Select Help > Browse Examples from any Sonnet tab.
The Example Browser opens.
Find the Getting Started Tutorial and select it.
You may use the search box or scroll down until you see the Getting Started Tutorial example.
Click the Save button at the bottom of the Example Browser window.
A Save Example window opens with a list of files that will be saved.
Enter or browse for the folder where you wish to place the example files.
Choose a location you can remember.
Click the Save button.
The example files are saved to the specified folder.
Click the Close button.
The Example Browser closes.
If you have not done so already, open the file, part3_finalized.sonx by selecting File > Edit Project > Browse for File(s) from the main Sonnet Session tab.
View Current Density
Select Launch > View Current.
A current density tab is opened with a plot of the current density data for your project with the first frequency of 0.1 GHz displayed.
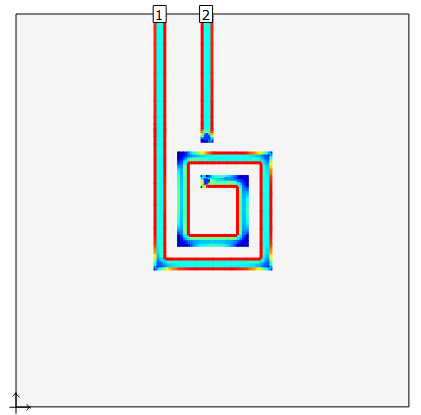
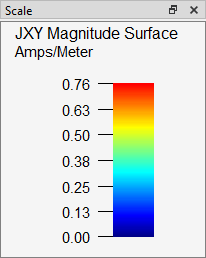
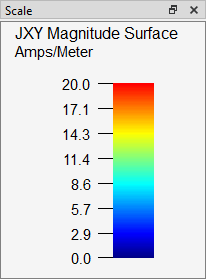
You are viewing the magnitude of the surface current density with a 1 Volt, 50 ohm source on Port 1 and a 50 ohm load on Port 2. Red areas represent high current density, and blue areas represent low current density. A scale is shown in the Scale panel which defines the values of each color.
You may open a Current Density tab from the Project Editor tab, a Graph tab, or the Job Queues tab. You may also click the Current button ![]() on the Project Editor or Job Queues tab toolbar.
on the Project Editor or Job Queues tab toolbar.
Move your cursor over your circuit and observer the Readout panel.
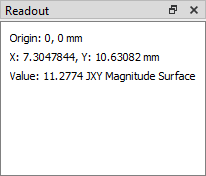
The current density value (in amps/meter) and coordinates are instantly updated in the Readout panel as you move your cursor.
Click on any point on your circuit.
The current density value (in amps/meter) at the point that you clicked is shown in the status bar at the bottom of your window along with the coordinates of the location. If you move your cursor without clicking, the status bar value does not change.
Click the Next Frequency button  on the toolbar.
When you first open a current density plot, the currents at the lowest frequency appear on your display. When you click the Next Frequency button, the display is updated with next highest available frequency. You may also press the left and right arrows on your keyboard to change frequencies, or use the frequency drop-down list to go to any analyzed frequency.
When a project uses an ABS sweep, current density data is only saved for the discrete frequencies and are usually unevenly spaced.
View 0.1 GHz again using any of the methods described above.
The display shows currents at 0.1 GHz.
Click the Level Down button  on the toolbar.
The current density on level 1 is displayed.
You may press the up or down arrows on your keyboard to navigate up and down on your stackup. You may also use the Stackup Manager or the drop-down list next to the Level Down button on the toolbar to navigate.
View level 0 again using any of the methods described in the previous step.
Level 0 shows the current density of main spiral inductor metal.
Select Plot > Ports.
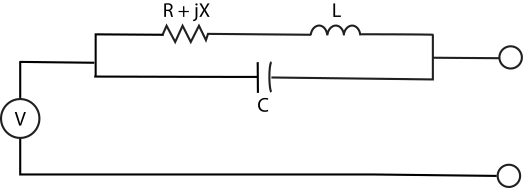
The Port Excitation dialog box appears. By default, port 1 is excited with 1 volt and all other ports are set to 0 volts. Also, by default, all port impedances are read from the project file. You may specify the port's voltage, phase, resistance, reactance, inductance, and capacitance as shown in the diagram below.
You can excite more than one port at a time and the current density will update accordingly.
Enter a value of 1.0 volt for port 2 and click the Apply button.
The current density changes to correspond to 1 volt applied to both ports 1 and 2.
Each time a change is made, the color scale maximum may change. This is because the scale is set to Auto Scale. You may also set the scale to a manual scale which won't change as you make changes to your view.
Note the maximum value of the scale in the Scale Panel.
Change the port 2 voltage back to 0.0 volts and click OK.
The Port Excitation dialog box is closed and the current density changes to correspond to 1 volt applied to port 1 and 0 volts on port 2. Note that the maximum value of the scale in the Scale Panel has changed.
In the next steps, you will learn how to force the maximum scale to be constant. This can be useful for comparing one set of conditions to another.
Select Plot > Scale.
The Scale dialog box is opened.
Select the Manual Scale radio button.
The Max Value and Min Value text boxes become available.
Enter "20" for the Max Value and click the OK button.
The maximum scale is changed to 20 amps/meter and the colors for the currents change accordingly.
Notice the scale as you change the frequency, level, and/or port values.
As you change any of these values, the scale remains at a maximum of 20 amps/meter.
This concludes the Current Density tutorial. For more information on the Current Density Viewer, see Current Density Plots.
Exiting Sonnet
You may exit sonnet by selecting File > Exit Sonnet from the main menu of any tab. The next time you open the software, the tabs that were open when you selected the exit command will reappear.
Getting Help
This tutorial was meant to introduce you to the basics of using Sonnet using a very simple example. However, Sonnet is a very powerful tool with many features ranging from simple to complex. If you ever need help using Sonnet, the following resources are available to you:
- The Sonnet User's Guide: This guide contains detailed information about every Sonnet feature, but has been organized in a straightforward manner in order to make it easy for you to find what you are looking for. See Guide_Intro to learn more about the User's Guide.
- Help Buttons: Each Sonnet tab contains a help button in the top-right corner of the tab. If you click this button, a help topic opens that is specific to the tab you have open. In addition, each time you enter a mode, a special help button appears for that mode. Clicking this button gives specific information on that mode. Also, most dialog boxes contain a Help button which, when clicked, opens a help topic that is specific to that dialog box.
- A Real Human: You may also call or email Sonnet and get help from a real human. Sonnet's Technical Support team is composed of experienced engineers who can help you with your specific questions. See Sonnet's Ask a Support Question web page for the various methods of contacting Sonnet Tech Support.